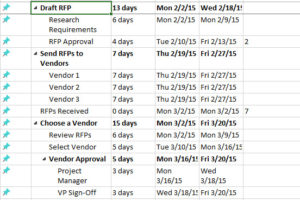
The Gantt Chart is basically a visual representation of a project schedule, showing the length of time to complete all the tasks, the task dependencies and often the critical path for the project.
The Gantt chart is named so because it was invented by Henry Gantt in the 1910’s. There are several reasons w“hy Gantt charts are still a popular option for project managers today.
What is a Gantt Chart in Project Management?
No reproduction without permission:GanttCharts.net » What is a Gantt Chart in Project Management?
Recommend
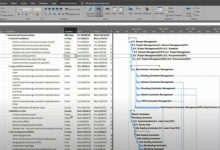
 How to Highlight the Critical Path in the Gantt Chart in Microsoft Project
- Full Gantt Chart , Critical Path , Minimum duration in 10 Minutes
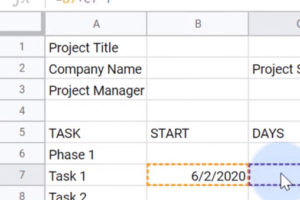
- How to Create a Gantt Chart in Google Sheets
- Gantt Chart Excel Tutorial - How to make a Basic Gantt Chart in Microsoft Excel 2013
- Using Gantt Chart to Improve Work Efficiency
- HOW TO CREATE A MICROSOFT PROJECT TIMELINE TEMPLATE
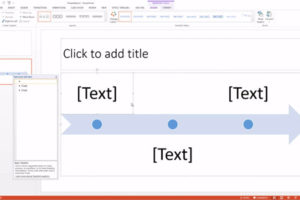
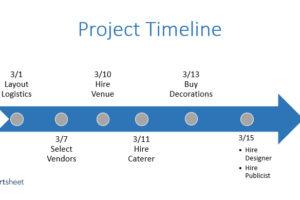
- How to Make a Timeline in PowerPoint
- How to Customize Your Timeline in PowerPoint