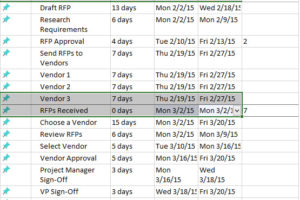
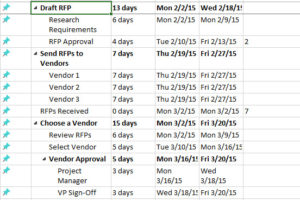
In this Microsoft Excel 2013 tutorial I show you how to make a basic Gantt Chart. This is a basic Gantt Chart that shows the time frame of a project and the time frame of the individual task that are to be performed. This Gantt Chart is basic so it doesn’t show the progress of the project.
Gantt Chart Excel Tutorial - How to make a Basic Gantt Chart in Microsoft Excel 2013
No reproduction without permission:GanttCharts.net » Gantt Chart Excel Tutorial - How to make a Basic Gantt Chart in Microsoft Excel 2013
Recommend
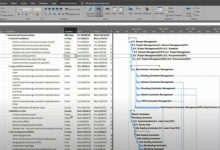
 How to Highlight the Critical Path in the Gantt Chart in Microsoft Project
- Full Gantt Chart , Critical Path , Minimum duration in 10 Minutes
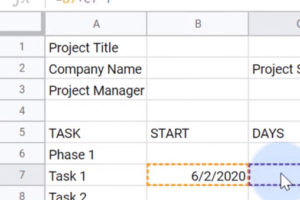
- How to Create a Gantt Chart in Google Sheets
- Using Gantt Chart to Improve Work Efficiency
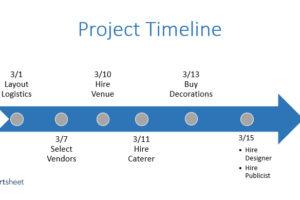
- HOW TO CREATE A MICROSOFT PROJECT TIMELINE TEMPLATE
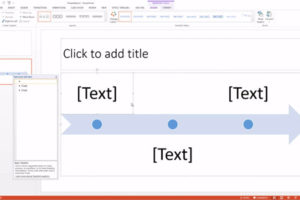
- How to Make a Timeline in PowerPoint
- How to Customize Your Timeline in PowerPoint
- Top 7 benefits that Gantt charts offer